This is an archival copy of the Visualization Group's web page 1998 to 2017. For current information, please vist our group's new web page.
Model Builder
Problem:
Experimental data is often noisy, producing difficult to understand data sets. Volume data with 2d features that are not easy to distinguish make a perfect case for building a model of these features that can help the researchers understand their topology. These surfaces if rendered as isosurfaces in the original data would be impossible to distinguish from the noise.
AVS/Express offers considerable flexibility for constructing sophisticated visualizations, however it does not provide a built-in module to construct models. The vis group built a custom module to interactively select points in slices of the volume data (uniform mesh), construct a line mesh and then join the lines into surfaces.
Solution:
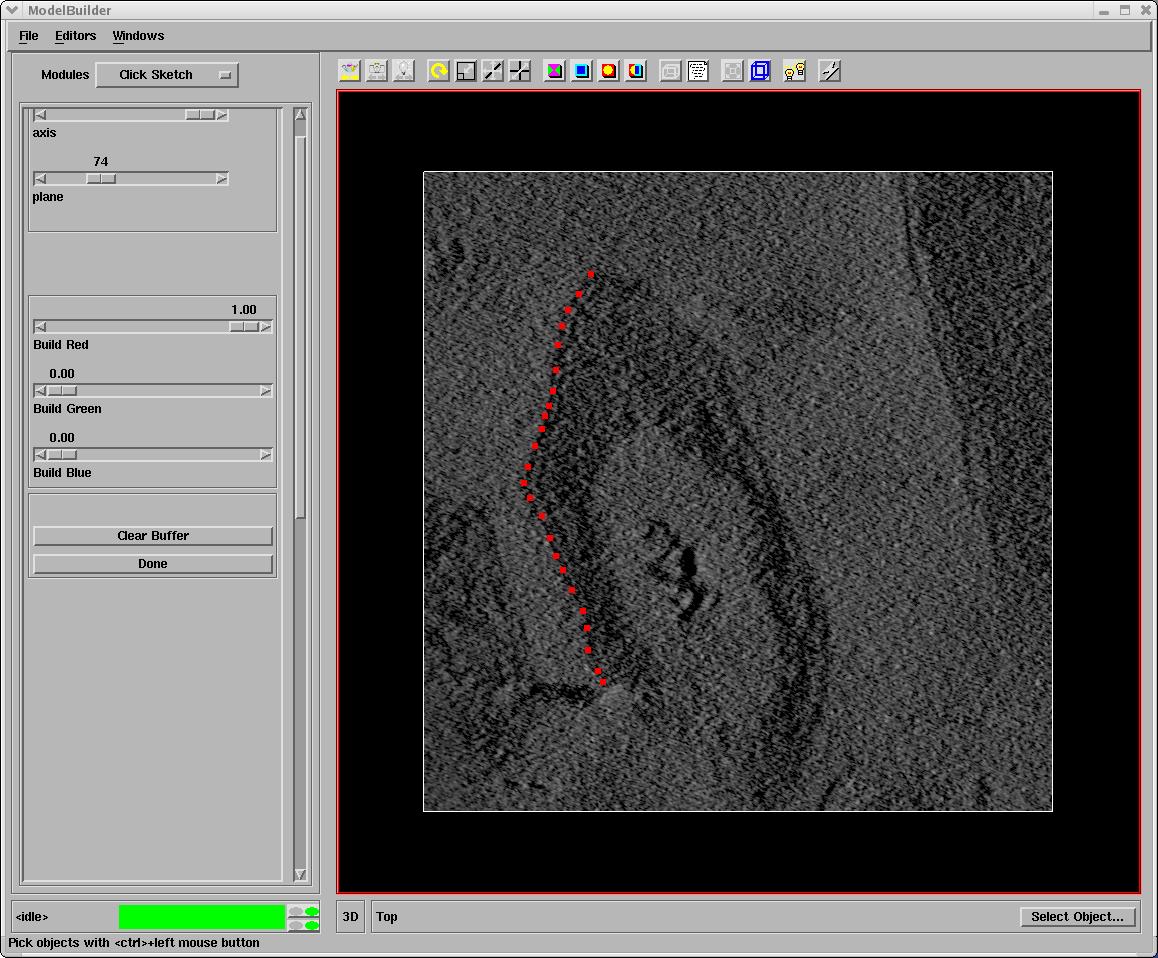
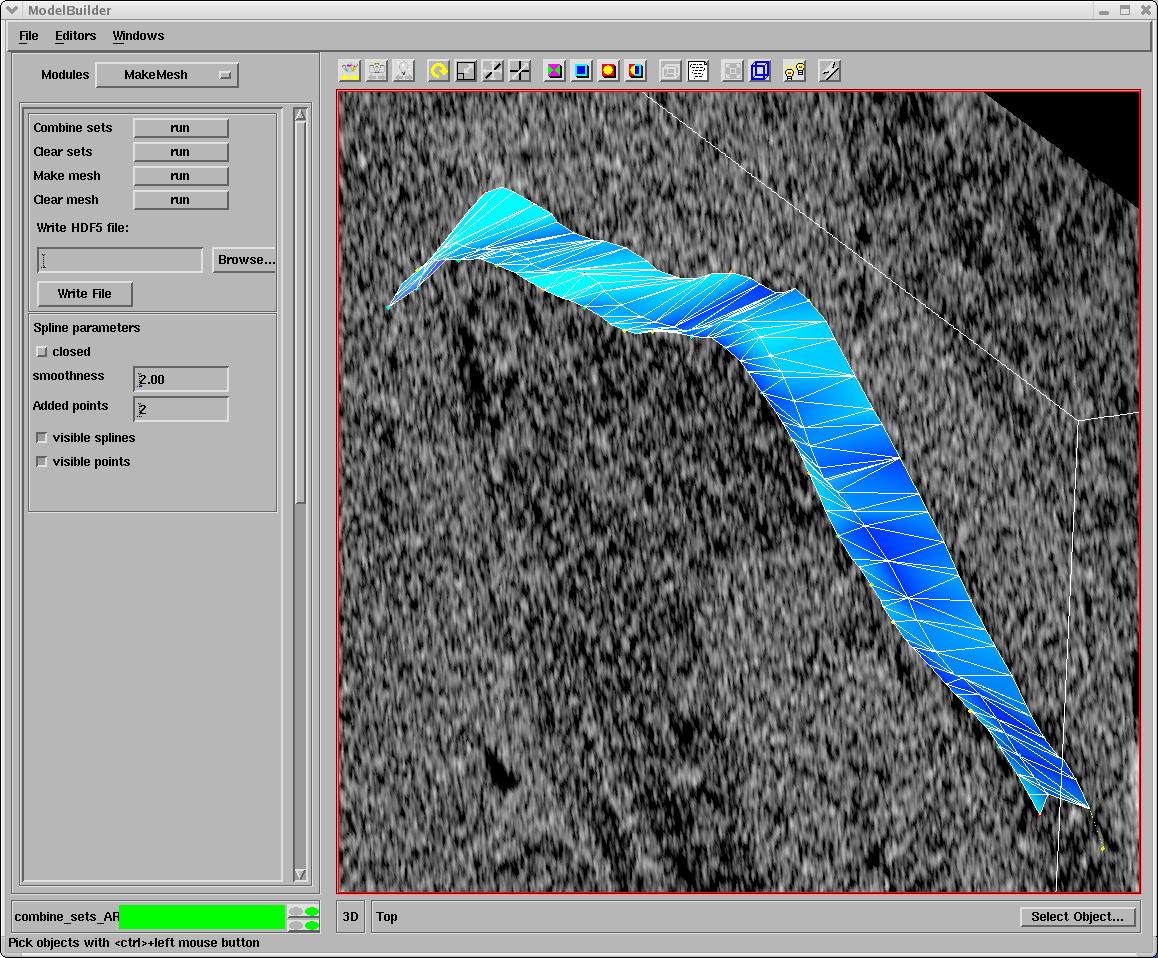
The model builder application uses AVSExpress build-in modules and several custom made ones. The user starts by selecting points in orthoslices of the data. Figure 1a,1b. After moving from slice to slice selecting points the user can make a mesh, first by joining the points with line fields and the by joining these lines to make a surface.
 |
 |
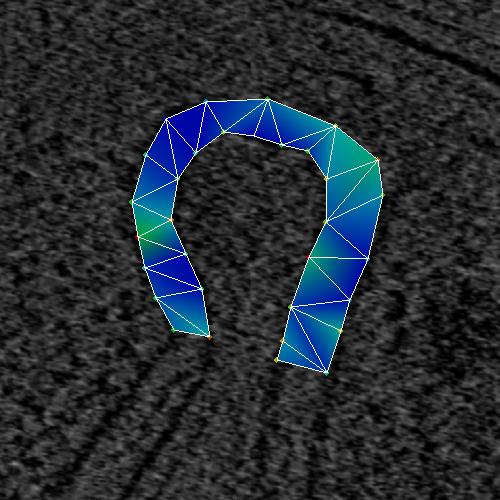
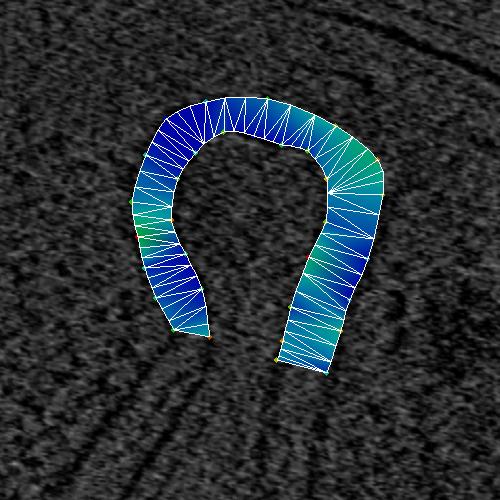
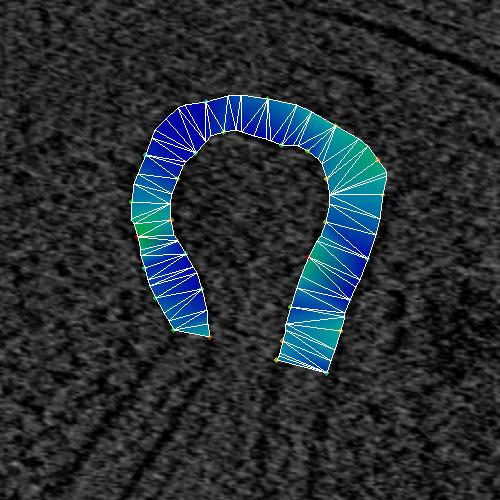
The line mesh has the option of joining the points with a cat-mull spline, with a smoothness and a added_points parameter. Figure 2a,b,and c show different settings for the splines.
 |
 |
 |
The MakeMesh interface allows to make closed lines. Figure 3 shows the selected points and Figure 4 shows the closed splines.
 |
 |
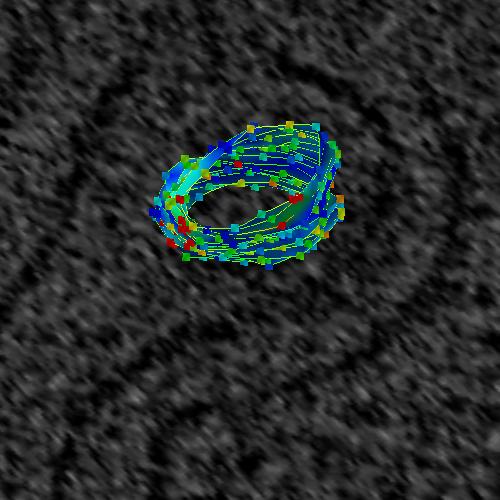
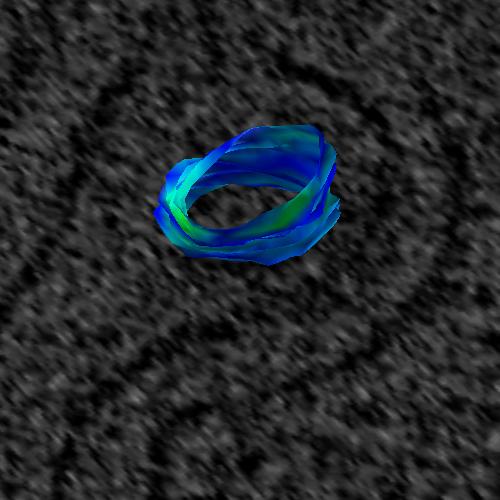
Two toggle buttons allow turning on and off the visibility of splines and points. Figure 5_a splines and points are on, Figure 5_b splines and points are off.
 |
 |
The generated surfaces, or the splines can be saved as HDF5 files (AVS/Express data model) for later use together with other rendering techniques.
 |