Shading Scales and Colour Maps
If your plot does not look like this then run step3.gsl
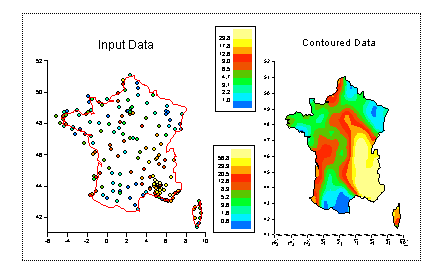
Looking at the two legends you can see that the class limits are different for the scatter plot and the contour plot. The reason for this is that the default method for selecting class limits is by "Percentiles", which means that the class limits are selected so that an equal number of points can be found within each class. This means that the contour will always show some form of detail, but the class limits are not necessarily evenly spaced.
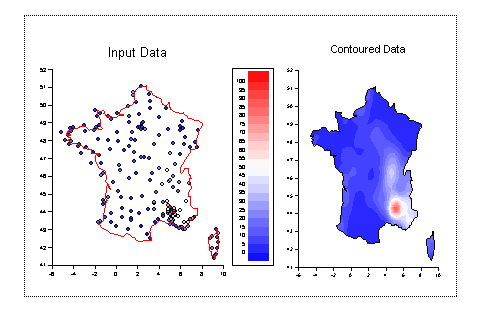
Edit both domains and go to Classes. Click on Class Editor. Set Classes Type to be "Limits". Set Min to be 0, Maximum to be 100. Click on OK. Set Number of Classes to be 21 and pick the Blue-White-Red Shading Scale. Click on OK.
Both legends are now identical so disable one of them.
Use the browser to move the scatter domain into the same viewport as the contour domain. (In the browser right click on the scatter domain and select Cut. Right click on the contour viewport and select paste). You can then delete the empty viewport and resize the combined viewport.
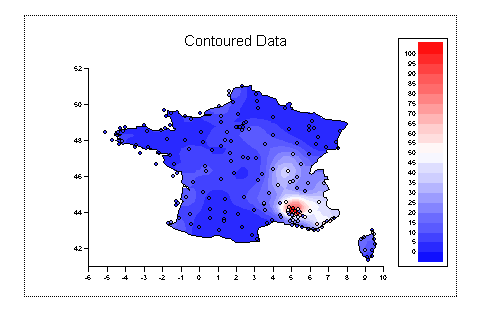
Our one viewport now contains both domains on top of each other. On this occasion both domains have the same limits, but when combining graphs like this you should normally ensure that both domains have the same limits, so that a point in the scatter domain corresponds to a point in the contour domain.
It is not possible to have a scatter graph and a contour plot in the same domain which is why we have to use two and then ensure they are in sync.
As our X and Y data is in degrees of latitude and longitude there is a relationship between them. If we use the cylindrical equidistant projection than we should ensure that 1 degree of latitude equals one degree of longitude. The simplest way to do this is to set the ratio of the X axis to the Y axis to be 16:11 (the range of the x axis is 16 degrees and the y axis 11 degrees).
Edit the viewport and under the ratio tag set X ratio to be 1.6 and Y ratio to be 1.1
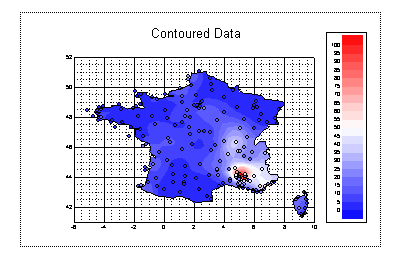
Finally edit the domain and under Switches turn on ticklines behind the contour:
In the next step we look at contouring in 3D and 4D