Step 2 - Creating Graphics
Overview
Before we start to look at our data we will just explore how Gsharp plots are made up of objects.
Gsharp Objects
As the figure above shows each plot in Gsharp is made up of objects and each object belongs to another object. So a graph belongs to a domain, which belongs to a viewport, which belongs to a page.
We can create an object at any time by clicking on its icon in the Object (lower) toolbar. The object will be created as a child of the currently selected object.
 HierarchyBrowser
The HierarchyBrowser is a Gsharp Tool which gives an overview of all the objects in your plot (see left). It can also be useful for selecting, deleting, copying and editing the objects.
Bring up the HierarchyBrowser by clicking on its icon on the Command Toolbar. Arrange the HierarchyBrowser next to Gsharp so that you can see all the objects as you create them.
The browser should just contain the page_1 icon. If there are more icons choose Reset All from the Gsharp File menu.
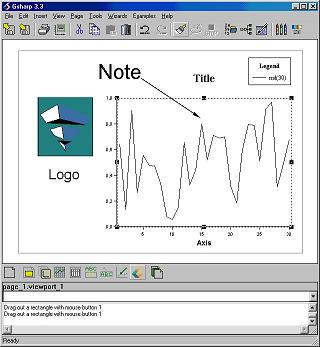
Find the viewport icon on the object toolbar and click on it. The cursor changes into a "corner". Drag out a reasonably sized viewport in the canvas.
Press and hold down the left
hand mouse button (MB1) where you would like to place one corner of the viewport. Keep holding the button down and drag the mouse to the opposite corner of your viewport and then let go.
You have now created a viewport!
Moving a viewport
To move or resize an object you must first select it (your viewport is already selected). A selected object is highlighted with a dashed line and has resize handles.
Resize your viewport by dragging one of the resize handles.
Hold down MB1 inside your viewport and the move cursor appears. Drag the viewport to a new position.
It is also possible to move notes, arrows, titles, legends and logos in the same way. First select the object and then drag it. It is also possible to rotate 3D graphs.
In the next step we look at how we can edit this viewport