SC 2004 LBNL Visualization Group Demos/Projects/Presentations
Table of Contents
NERSC-related
Other Projects
Talks
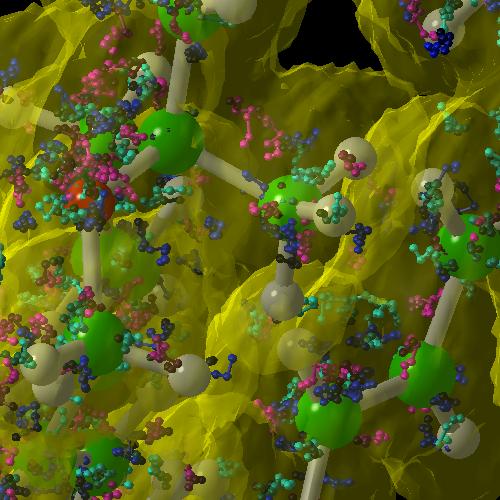
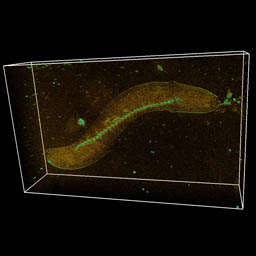
Visualization of Electron Walkers Computed by Quantum Monte Carlo Simulation of Energy Pathways in Photosynthesis Reactions (Incite 1)
- Title: Visualization of Electron Walkers Computed by Quantum
Monte Carlo Simulation of Energy Pathways in Photosynthesis Reactions
- Description:
This Incite project, led by William A. Lester, Jr. of LBNL and UC Berkeley,
aims to increase understanding of the complex processes that occur during
photosynthesis, the process by which plants and bacteria convert the
sun's light into energy. As part of a multidiscplinary collaborative team, the
NERSC Visualization Group performs advanced development to create and
apply visualization technology aimed at increasing scientific insight into
the complex output from Incite1's Quantum Monte Carlo simulation
that models electron pathways through carotenoids and cholrophyll during
a photosynthesis reaction.
-
The web page for the self-guided Incite1 demo.
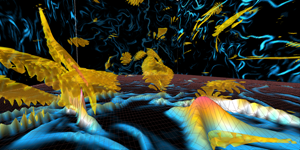
Incite3: Visualization Helps Provide Insight into 3D Fluid Turbulence and Mixing at High Reynolds Number
- Title: Visualization Helps Provide Insight into 3D Fluid Turbulence and Mixing at High Reynolds Number.
- Description: In a collaboration with P.K. Yeung of Georgia Tech, the NERSC
Visualization Group documents the evolution of visual data analysis methods and
techniques that reveal never-before-seen features in high resolution data
now being produced by the Incite3 project hosted at NERSC.
-
The web page for the self-guided Incite3 demo.
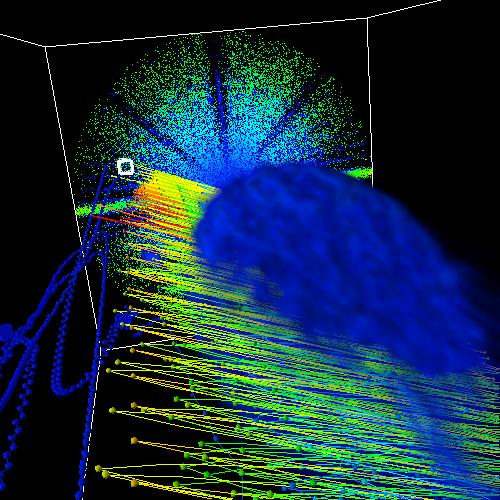
Visualization of the Electron-Cloud Effect (ECE)
- Title: Visualization of the Electron-Cloud Effect (21st Century
Accelerator SciDAC)
- Description:
This project, a collaboration with Andreas Adelmann from PSI, aims at
studying the electron cloud instabilities that can disrupt the main
accelerator beam. The simulation results, which consist of particles'
(protons, electrons) position and phase (velocity), are large and
complex datasets that are difficult to manipulate and understand.
The NERSC Visualization group developed and applied technologies to
facilite rapid exploration and visual analysis of accelerator modeling
simulation results. Our SC04 demonstration illustrates visualization
techniques that aid in gaining scientific insight, as well as
architectures for remote and distributed visualization of large accelerator
modeling simulation output.
-
The web page for the self-guided Accelerator Modeling Visualization demo.
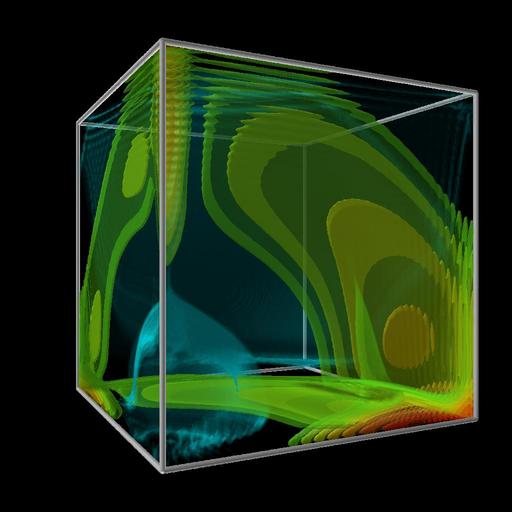
LBNL Remote, Distributed and High Performance AMR Visualization
|
- Title: LBNL Remote, Distributed and High Performance AMR Visualization
- Description:
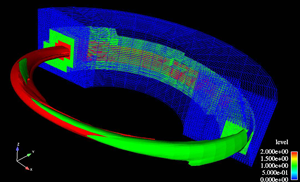
Adaptive Mesh Refinement (AMR) is a technique for automatically refining
(or de-refining) regions of a computational domain during a numerical
calculation based upon application-specific criteria, like flamefront
tracking during a combustion simulation.
The multiresolution and hierarchical nature of AMR grids presents
special challenges for mainstream visualization tools, which typically
can operate only on single grid domains.
At SC04, the LBNL Visualization Group will show ongoing AMR visualization
activities.
First, LBNL's hardware-accelerated volume renderer is being used to create
images for a PBS special movie on cosmology. Second, the group will
demonstrate use of custom data converters that permit AMR grids to be
visualized using CEI's Ensight and LLNL's Visit, both of which are
applications that implement a pipelined/parallel architecture and are
effective in remote and distributed visualization contexts.
-
The web page for the self-guided
AMR Visualization demo.
Visualization of Computational Atomic Physics for Fusion
- Title: Visualization of Computational Atomic Physics for Fusion
- Description:
Atomic physics plays a central role in many of the high temperature and
high density plasmas found in magnetic and inertial confinement fusion
experiments, which are crucial to our national energy and defense interests,
as well as in technological plasmas important to the US economic base. In
turn, the development of the necessary atomic physics knowledge depends on
advances in both experimental and computational approaches. The
Computational Atomic Phyics for Fusion SciDAC project hosted at NERSC
is producing early results simulating time evolution of a wavepacket
scattering from a Helium atom. Our SC04 demonstration reflects collaborative
effort between M. Pindzola (Auburn University) and the NERSC Visualization
group to create visualizations of these early results.
-
The web page for the self-guided
Atomic Physics for Fusion demo.
Structural Biology
- Title: Visualization of three-dimensional reconstructions of Electron Tomography
Studies of Bacterial Structure and Function.
- Description: In a collaboration with K. Downing of LBNL's Life Sciences
Division, the NERSC Visualization Group documents the process of identifying,
visualizing and analyzing cellular-level structures observed in data
acquired through Electron Tomography.
- The web page for the self-guided Structural Biology demonstration.
Meeting Challenges in Molecular Biology Through Interactive Visual Data Analysis
- Title: Meeting Challenges in Molecular Biology Through Interactive Visual Data Analysis (ProteinShop)
-
Description:
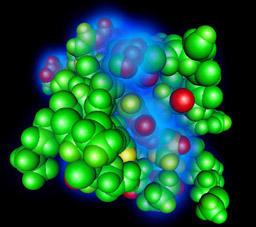
Predicting the three-dimensional structure and function of
proteins from fundamental chemical building blocks is one of the grand
challenges in biology. Understanding molecular structure and function will
yield new insights into fundamental biochemical processes that in turn create
the opportunity for new scientific and medical advances.
Researchers at Lawrence Berkeley National Laboratory will demonstrate recent
technological advancements that help to accelerate protein structure
determination using computational approaches.
The SC04 demonstration will focus on visual data
analysis processes that aid in understanding the relationship between
the folding process of a protein molecule its internal free energy.
-
The web page for the self-guided ProteinShop demo.
Immersive Information Visualization for Exploration, Discovery and Analysis
|
- Title:
Immersive Information Visualization for Exploration, Discovery and Analysis
- Description:
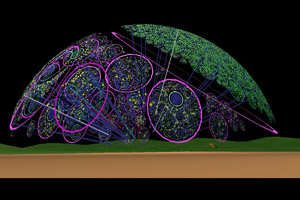
This project aims to leverage several technologies to aid in visual
data analysis of several different types of information, with an
emphasis upon cybersecurity applications.
We will show ongoing work in collaboration between LANL, UNM, and LBNL
on several projects: network monitoring for intrusion detection, domain
name heirarchy analysis, supercomputing architecture and dynamics,
transaction analysis, and critical infrastructure protection decision support
systems. The Flatland virtual reality framework developed at UNM and the
Flux data flow environment developed at LANL were used to develop these
real-time, interactive, immersive demonstrations. Simulation and real-time
data are from the ASCI program, NNSA , DHS, and LANL and LBNL network
security projects.
-
The web page for the self-guided Immersive Information Visualization demo.
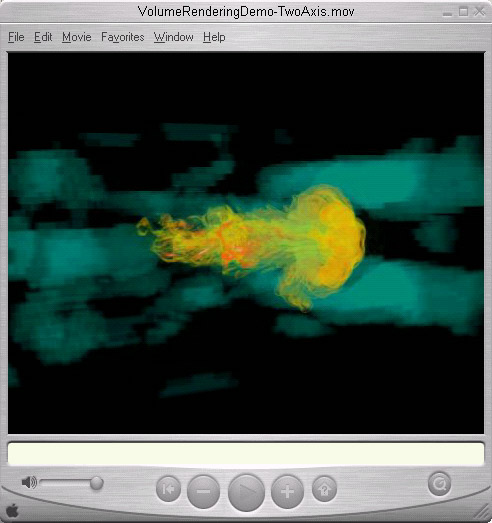
MBender: Leveraging QuickTime VR as a Delivery Vehicle for Remote and Distributed Visualization
|
- Title:
MBender: Leveraging QuickTime VR as a Delivery Vehicle for Remote and Distributed Visualization.
- Description:
In remote and distributed visualization settings, the viewer is in
one location while the data to be analyzed or visualizations is located
somewhere else. Typically, "somewhere else" is an a high performance
mass storage system located at the large supercomputer center where the
simulation was run or experimental data cached. Research in remote
and distributed visualization focuses on alternative partitionings for
the visualization pipeline with the aim of maximizing performance through
the pipeline. This project explores the use of the industry-standard
QuickTime VR Object Movie as a delivery vehicle for interactive,
3D visualization. QTVR is an attractive media format because it allows
3D interaction with time-varying, pre-computed visualization results.
-
The web page for the self-guided MBender demo.
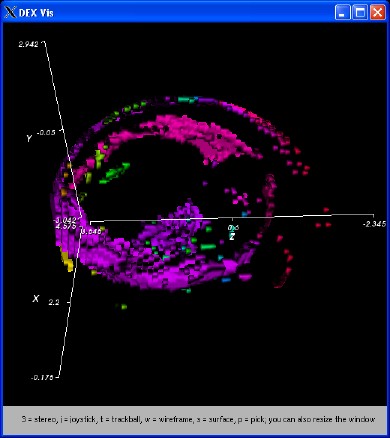
Query Driven 3D Visualization Using Fastbit Indexing
|
- Title:
Query Driven 3D Visualization Using Fastbit Indexing
- Description:
FastBit is a software tool that provides efficient high-dimensional query
capabilities based on bitmap indices. It relies on the fact that most
scientific data is append-only, and uses a specialized compression method
developed at LBNL to achieve search speeds faster by a factor of 10 over
the best known high-dimensional indexing methods. FastBit can be applied
to spatio-temporal data. It uses the bitmap technology for region-finding
based on multiple features of the mesh points, such as "temperature"
and "pressure." It also provides very efficient region growing algorithms
using the bitmaps for both 2D and 3D data. These algorithms allow one to
search for regions of interest such as stellar objects in astrophysics or
flame fronts in combustion studies. In this demo we are combining FastBit
with 3D visualization. In particular, we demonstrate how to perform
multi-dimensional queries for identifying regions of interest of supernova
studies. Traditional visualization frameworks usually operate only on
one-dimensional queries. By integrating FastBit into the visualization
framework, it is now possible to perform interactive, efficient
feature-based analysis and region finding for high-dimensional queries.
By displaying the resulting regions of interests, the application
scientists can quickly identify characteristic features of their data
analysis.
-
The web page for the self-guided Fastbit demo.
Talks
Science-Driven Visualization Research Challenges
The ever growing size and complexity of data from scientific simulations
is creating a bottleneck in analyzing and understanding simulation results.
In addition, while the computations tend to be performed at centralized
facilities, analysis is performed by distributed teams of scientists at
remote locations. The LBNL Visualization research effort focuses on
combining fundamental science-driven visualization research to
accelerate data understanding in both a remote and distributed context.
(This talk will focus on our vis research effort, couched in terms
of science-driven motivations).
SC04-LBNL-Visualization.pdf (7MB).
SC04 NERSC User Group Meeting - Visualization Topics
Our Visualization Program update at the SC04 NUG meeting focused on
introducing our new NERSC visualization platform, davinci.nersc.gov.
SC04-NUG-Visualization.pdf.
