Seeing is not believing...
This is a tale of how blindly trusting commercially available visualization tools can lead to an incorrect interpretation of results.
To begin with, here's an image of a 2d Gaussian filter:

The size of this filter (convolution kernel) is quite small, five by five
values. So, we'll interpolate it up 64 times using point sampling:
 Note that we're using the interpolation module supplied with a commonly-used
visualization package.
Next, we'll interpolate up, 64 times, the original kernel, but use the
vendor's bilinear interpolation tool. The results are surprising:
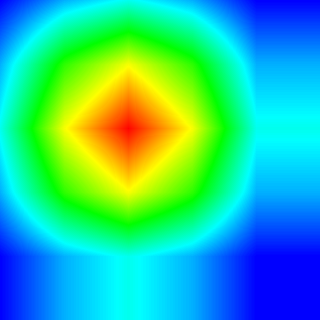
There are clearly some problems with the interpolation module (btw, these were reported to the vendor years ago, and this bug has still not been fixed, though acknowledged, through several major releases of this software).
Next, we move into the world of three dimensions. A petroleum reservoir
simulator computes concentrations of oil, water and other chemicals over
time. In our examples shown below, we are depicting an isosurface of
a constant water concentration level in blue. Note how the shape of
this surface surrounds the water injection well. In brown is shown
an isosurface of constant oil concentration. In this particular model,
we're working with only two phases, oil and water, so the total
concentration at any given grid location must sum to 1.0. In other
words, if there's 60% water, the other 40% is oil. The water isosurface
level in these images is 60%, and the oil isosurface level is set to
45% so that the two surfaces are not identical.
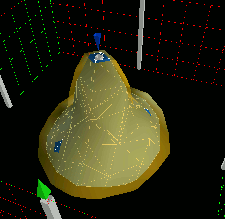
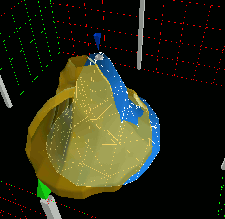
The image below shows what happens if we use the vendor's interpolate
module on one of the phases, in this case oil. The oil has changed
places! We discovered this while making movies of this simulation and
using direct volume rendering for the oil and conventional isosurfaces for
the water. One of the scientists on the project asked why there was still
oil left in the field after the water flood has passed through. As it
turns out, it was simply an error in the vendor's software.
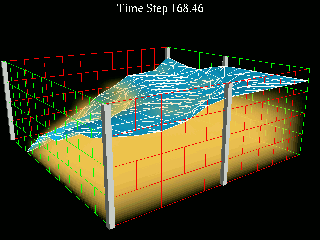
To present the problem in a slightly different way. The below image shows
the oil concentration using direct volume rendering and an isoconcentration
surface of water. What's wrong with this picture? The answer is that there
appears to be oil "left behind" after the water sweeps through.
The End.