ParaView is a turnkey application developed by Kitware that is built on top of the Visualization Toolkit (VTK). ParaView is designed to handle large data sets by distributing the data across multiple computers, but can also be used as a stand-alone single-process application.
ParaView's user interface and operations are closely tied to the pipeline model in VTK. Loading data creates a VTK reader object, and processing data (i.e. creating a contour) adds a VTK filter to the pipeline. Creating a single non-branching pipeline using ParaView is trivial. Each new filter adds to the end of the pipeline. ParaView also allows advanced users to construct, navigate and modify complex branching pipelines.
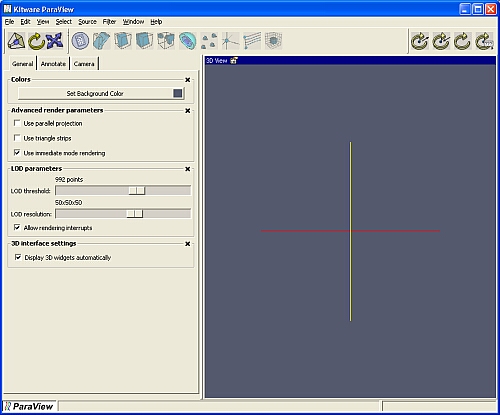
At startup, ParaView will appear as shown above. There are several regions to the user interface including the Menu Bar along the top of the application, the Toolbar just below the Menu Bar, the Left Panel on the left side which may contain a Property Sheet and the Selection / Navigation Window, the Display Area on the right side, and the Status Bar along the bottom edge. Each of these areas is described in more detail below.
The Menu Bar
The top menu bar provides menu buttons for loading and saving data, changing property sheets, creating sources and filters, viewing other windows, displaying help, and other standard functionality. Each menu button is described in more detail below.
File: The File menu can be used to load and save data files, export VTK scripts, load and save session files, save and print images, and exit the application.
Edit: The Edit menu can be used to delete all data from the application, and to copy the current image to the clipboard. (Copy functionality only available on Windows)
View: The View menu can be used to select the Property Sheet displayed in the Left Panel of the application. Most of the functionality of ParaView will be contained in these property sheets. This is where the properties of sources and filters are set, application and 3D display settings such as background color, level of detail parameters, and camera controls are located, and animations can be created.
Select: The Select menu also controls the Property Sheet displayed in the Left Panel of the application. The Select menu contains an entry for each data object loaded or created in the system. Selecting one of these will bring up its corresponding property sheet in the Left Panel area of the user interface. There are also three standard glyph sources that can be accessed through the Glyphs submenu. Selecting a source using the Select menu is similar to selecting it using the Selection / Navigation Window.
Source: The Source menu contains a list of sources that can be created. After selecting a source from the list, the property sheet for that source will be displayed in the Property Sheet area. Set the parameters then press the Accept button to create the source, or the Delete button to cancel this operation.
Filter: The Filter menu contains a list of filters that can be applied to the currently selected data object. This will generally be the last data object created, or the one most recently selected from the Select menu or the Selection / Navigation Window. The list of filters available in the Filters menu will change to correspond with the type of the selected data object. Once a filter is selected, the Property Sheet for that filter will be displayed. Set the parameters and press Accept to add the filter to the pipeline just after the currently selected data object, or press the Delete button to cancel this operation.
Window: The Window menu can be used to hide or display the Left Panel. In addition, the Window menu can be used to bring up the Command Prompt, Error Log, or Timer Log windows.
Help: The Help menu can be used to display this Help or version information on ParaView.
The Toolbar
The Toolbar is located directly below the Menu Bar. The Toolbar contains buttons for resetting the camera, switching between 2D and 3D interaction modes, and changing the center of rotation. In addition, the Toolbar contains buttons for some common filters.
The Left Panel
The Left Panel displays the current Property Sheet on the bottom and the Selection / Navigation Window on the top. The Selection / Navigation window will not appear until data has been loaded or created. The Left Panel may be hidden or revealed using the Window menu on the Menu Bar. The current contents of the Left Panel is controlled by the View and Select menus in the Menu Bar, or by selecting a data object from the Selection / Navigation Window.
The Display Area
The Display Area is where the 3D representation of the scene is rendered. Mouse and keyboard interaction are provided in this area.
The Status Bar
The Status Bar on the bottom edge of the application will provide short help messages, progress updates, and an error indicator (a small red exclamation point in the far right corner). Clicking on the error indicator will bring up the Error Log and change the color of the exclamation point to black.