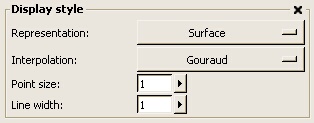
On the Display tab of the
property sheet that is associated with a data object in ParaView you will
find a Display style region similar to the one shown in the image on the
right. In this area you can change the representation of the data, the
interpolation method, and the size of points and lines as described below.
Representation:
You can choose between a surface, a wireframe or a point representation
of the data. When a surface representation is selected, primitives such
as polygons and triangles are drawn as filled geometric primitives. When
wireframe mode is selected, only the edges are drawn. In point mode, only
the points defining the geometry are displayed.
Interpolation:
In Gouraud interpolation the normal will be interpolated over the face
of a polygon for shading. When flat shading is selected only one normal
will be used per polygon leading to a more faceted appearance. Objects
that do not have point normals will be drawn with flat shading regardless
of the setting of the pulldown.
Point
size: When displaying points either as part of the data object
or due to a Representation of points, the point size can be controlled
with this slider.
Line width:
If lines are being drawn for the data object (either because lines are
a part of the data object or because the representation has been set to
wireframe) then this slider can be used to control the thickness of the
lines.
 On the Display tab of the
property sheet that is associated with a data object in ParaView you will
find a Display style region similar to the one shown in the image on the
right. In this area you can change the representation of the data, the
interpolation method, and the size of points and lines as described below.
On the Display tab of the
property sheet that is associated with a data object in ParaView you will
find a Display style region similar to the one shown in the image on the
right. In this area you can change the representation of the data, the
interpolation method, and the size of points and lines as described below.