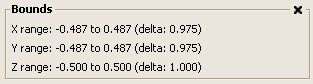
 Below the Statistics region
on the Information tab of the property sheet associated with a data object
is a region for displaying bounds. An example is shown in the image on
the right. The range on each axis is displayed both as the minimum and
maximum coordinate in the data object on that axis and as a delta value
between the two extremes.
Below the Statistics region
on the Information tab of the property sheet associated with a data object
is a region for displaying bounds. An example is shown in the image on
the right. The range on each axis is displayed both as the minimum and
maximum coordinate in the data object on that axis and as a delta value
between the two extremes.