How do I project my data?
The following projections are available within Gsharp:
UTM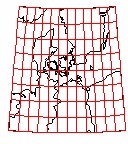
| Transverse Mercator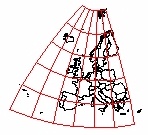
| Mercator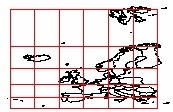
|
Lambert Conformal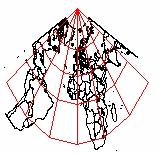
| Azimuthal Stereographic
| Gnomonic
|
Other projections can be implemented in GSL
There are many functions for controlling the built-in projections and they are described in the GSL function reference section. The main three routines are:
- proj_type() - to set the projection
- proj_origin() - to set the origin of the projection
- proj_transfrom() - projects (latitude,longitude) data.
As you can see from the example below the only other step you must consider is setting the X Ratio and the Y Ratio of the viewport so that 1 unit of X equals 1 unit of Y. The simplest way to get this correct is to set xRatio equal to the range of the X axis and yRatio equal to the range of the Y axis.
Once you have set up the projection using proj_type and proj_origin, you must then call proj_transform everything that you want to add to your plot - the data, a worldmap, a grid.
#Example
import_worldmap("", "full", "CoastLong", "CoastLat", -90,-60,15,40);
BermudaLong = -65 // -81.6// -66.2// -65;
BermudaLat = 32.33//  30.5//  18.5//  32.33;
proj_type("utm");
proj_origin(12,55);
proj_transform(CoastLong, CoastLat, "CoastLongP", "CoastLatP"); proj_transform(BermudaLong, BermudaLat, "BermudaLongP", "BermudaLatP");create Viewport page_1.viewport ( XuNxRatio = 3, XuNyRatio = 3 ); create Domain page_1.viewport.domain; page_1.viewport.domain.xaxis1.XuNaxle = false; page_1.viewport.domain.yaxis1.XuNaxle = false; create Graph page_1.viewport.domain.graph_1 ( XuNgraphType = "line", XuNxData = "CoastLongP", XuNyData = "CoastLatP" ); create Graph page_1.viewport.domain.graph_2 ( XuNgraphType = "line", XuNxData = "BermudaLongP", XuNyData = "BermudaLatP" );