How do I add a worldmap and a grid to my plot?
Worldmaps and grids can be added to your plot as line graphs. Each section of coastline or line of latitude/longitude must be separated by an UNDEF value.
If you are adding a worldmap and/or a grid to a contour plot, then you will have to add them in a new domain, as lines and contours cannot share domains. Make sure that the limits of the two domains are equal so that the points correspond!
Gsharp includes a function import_worldmap() for reading country borders.
| Syntax: | float import_worldmap(string countryCodes, string resolution, string longitude, string latitude, float minLongitude, float maxLongitude, float minLatitude, float maxLatitude) |
| Description: | Retrieves country borders from the Worldmap
Databank I database.
|
A similar function to create datasets for using as grids is the function import_worldgrid(). This is not built into Gsharp, you must include the GSL code show below its description.
| Syntax: | float import_worldgrid(float resolution, float xstep, float ystep, string xout, string yout, float xmin, float xmax, float ymin, float ymax, ) |
| Description: | Creates grid datasets for projecting and
overlaying on maps.
|
function import_worldgrid(float res, float xstep, float ystep, string LONG,
           string LAT,float mnlong, float mxlong, float mnlat, float mxlat)

  float x,y,xpts, ypts,xlines, ylines;

  xpts = range(mnlong//mxlong,res);
  ypts = range(mnlat//mxlat,res);
  $LONG=undef;  $LAT=undef;

  xlines = (int(mnlong/xstep+.999):int(mxlong/xstep))*xstep;
  ylines = (int(mnlat/ystep+.999):int(mxlat/ystep))*ystep;

  for x in xlines
    $LONG = $LONG //  repeatx(x,size(ypts)) // undef;
    $LAT = $LAT // ypts // undef;
  endfor

  for y in ylines
      $LONG = $LONG //  xpts // undef;
      $LAT = $LAT // repeatx(y,size(xpts)) // undef;
  endfor

endfunction
These two functions, import_worldmap and import_worldgrid, can be used to overlay your plots with a worldmap and grid. They can be projected using the standard projection functions.
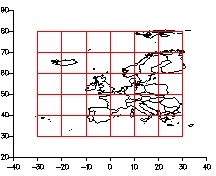
Example
# include the definition of import_worldgrid() above.

import_worldmap("EUR","full");
import_worldgrid(10,10,10,"GLong","GLat",min(Long),max(Long),min(Lat),
max(Lat));
proj_type("utm");
proj_origin(avg(Long), avg(Lat));
proj_transform(Long, Lat, "CLongP", "CLatP");
proj_transform(GLong, GLat, "GLongP", "GLatP");
create Viewport page_1.viewport;
create Domain page_1.viewport.domain;
page_1.viewport.domain.xaxis1.XuNaxle = false;
page_1.viewport.domain.yaxis1.XuNaxle = false;
create Graph page_1.viewport.domain.worldmap
 ( XuNgraphType = "line",
   XuNxData = "CLongP",
   XuNyData = "CLatP"
 );
create Graph page_1.viewport.domain.grid
 ( XuNgraphType = "line",
   XuNxData = "GLongP",
   XuNyData = "GLatP"
 );