Using Graphic Objects |
|
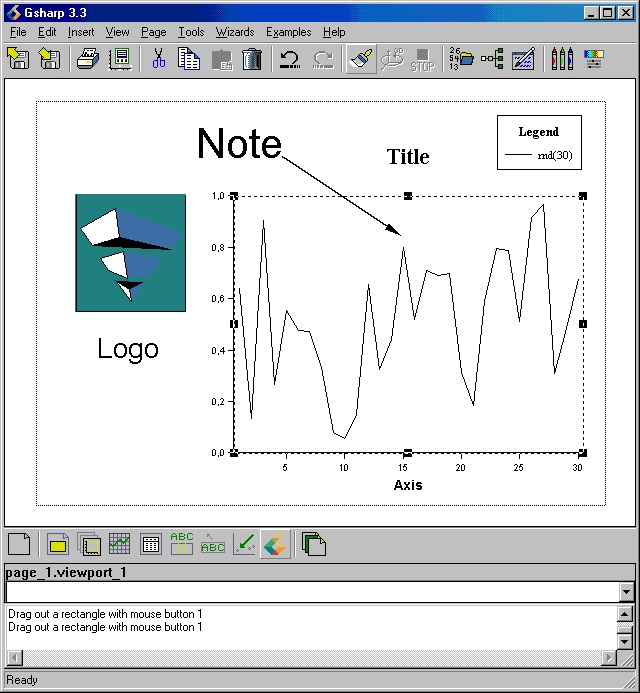
What are objects?Gsharp's graphs are made up of objects. There are elleven objects in total of which ten are shown in the diagram: Page, Viewport, Domain, Graph, Datasheet, Axis, Legend, Note, Arrow, Title and Logo Each object has a set of resources which can be configured, e.g. the size and position of the object. |
Object Hierarchy
Each object belongs to another object, for example a title belongs to a viewport and a viewport belongs to the page. If you move or delete an object, you will move or delete the objects that belong to it.
There are strict rules about what type of object an object can belong to. For example, a title must belong to a viewport. It cannot belong directly to the page or to another title. This hierarchy is shown below:
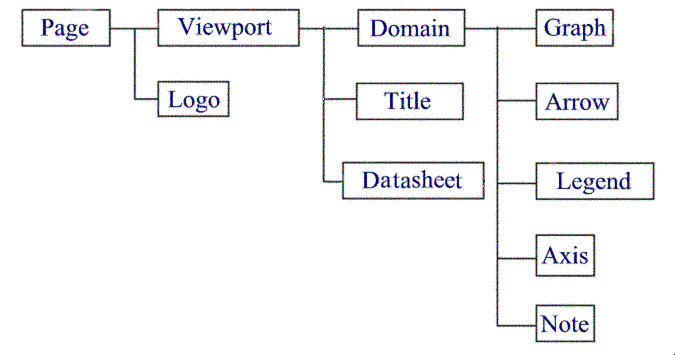
The full name of an object includes all the objects it belongs to separated
by "."s.
e.g. page_1.logo_1 and page_1.viewport_1.title_1
Each object is now described in detail:
- The Page object
- The Viewport object
- The Datasheet object
- The Domain object
- The Axis object
- The Legend object
- The Graph object
- The Note object
- The Arrow object
- The Title object
- The Logo object
Return to Gsharp User Guide
| Class Name: Page | |
| Parent object: None | Valid children: Viewport, Logo |
|
The page is the topmost object and there can only be one page. It is called page_1. The Page object's resources allow you to control items such as the background color, the size of the drawing area, the margins and the orientation. | |
Return to Object List
| Class Name: Viewport | |
| Parent object: Page | Valid children: Domain, Title |
|
The viewport is the area in which graphs are plotted. There is no limit to the number of viewports and they can be positioned anywhere on the page. The Viewport object's resources allow you to control items such as the size and position of the viewport, the background color, whether the viewport has a frame and the frame color. | |
Return to Object List
| Class Name: Datasheet | |
| Parent object: Viewport | Valid children: None |
|
The datasheet is an area in which the values of a dataset is plotted. There is
no limit to the number of datasheets. The Datasheet object's resources allow you to control many aspects of the appearance of the number such as font, color, alignment and format and the style of the frame around the values. | |
Return to Object List
| Class Name: Domain | |
| Parent object: Viewport | Valid children: Arrow, Axis, Graph, Legend, Note |
|
The domain object provides a means for organizing the axes, data limits and data units for one or more graphs. Each domain defines a coordinate system which provides common axes for all of the graphs in that domain. The domain type is set based on the graphs that are added to it. Each domain always has one legend object which is created and destroyed automatically with the domain. A 2D domain always has 2 X axes and 2 Y axes. A 3D domain always an X, a Y and a Z axis. They are also created and destroyed automatically with the domain. Domains are not visible on the page, but they can be selected by clicking at the top or bottom of the y-axis. Multiple domains can be included in a single viewport. | |
Return to Object List
| Class Name: Axis | |
| Parent object: Domain | Valid children: None |
|
The axis object reflects the coordinate system defined by the domain object it belongs to and provides a scale by which the graphed data can be measured. Axes cannot be created or destroyed - their existence is controlled by the domain object. Some axes are disabled by default - they must be enabled (either in the hierarchy browser or the axis editor) before they are visible on the page. | |
Return to Object List
| Class Name: Legend | |
| Parent object: Domain | Valid children: None |
|
The legend object resources control the definition and appearance of a legend for the domain. Legends are always drawn in 2D, even for a 3D domain. Legends from different domains can be combined by setting the AppendLegend resource. Legends cannot be created or destroyed - they are created and destroyed with the domain object. By default the legend is not displayed - it must be enabled (either in the hierarchy browser or in the legend editor). | |
Return to Object List
| Class Name: Graph | |||||||||||
| Parent object: Domain | Valid children: None | ||||||||||
|
The graph object resources control the type of graph that is drawn. There is no limit to the number of graphs that can be added to a domain, but they must all belong to the same type of domain. For example:
| |||||||||||
Return to Object List
| Class Name: Note | |
| Parent object: Domain | Valid children: None |
|
The note object allows you to create and position text strings on the graph. The position and size of notes is normally relative to the viewport they belong to, but it is also possible to specify these values in mm or inches - the position is then relative to the page. | |
Return to Object List
| Class Name: Arrow | |
| Parent object: Domain | Valid children: None |
|
An arrow object is a line with an optional head and tail which can be used to annotate the graph. | |
Return to Object List
| Class Name: Title | |
| Parent object: Viewport | Valid children: None |
|
The title object is used to create a title for a viewport. If multiple titles are created they are stacked on top of each other and their position is taken from the first title. Titles have a horizonal justification of left, center or right. For more control over the horizontal justification use a Note. | |
Return to Object List
| Class Name: Logo | |
| Parent object: Page | Valid children: None |
|
The logo object allows you to add images stored in external files to the page. Gsharp currently supports CGM files, TIFF and PNG image files. | |
Return to Object List
Return to Gsharp User Guide