How do I fit a line?
There are three methods for fitting a line to a set of (x,y) points - these are
Spline and Smooth
The ability to generate a smooth line using cubic spline interpolations is provided by the Graph object and is available as a GSL function. There is also an interactive dialog box that allows you to access this GSL function. This dialog is accessed via the Interpolation menu of the DataManager.
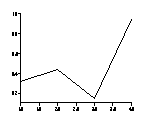
If you have plotted your data as a line graph in Gsharp. e.g.
x = 1:4; y = rnd(4); create Viewport page_1.viewport_1; create Domain page_1.viewport_1.domain_1; create Graph page_1.viewport_1.domain_1.graph_1 ( XuNgraphType = "line", XuNxData = "x", XuNyData = "y" ); |
|
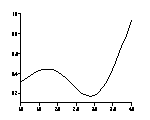
Then you can smooth the line by setting a smoothing factor of between 1 and 9 and the number of points between each input point to be one or more. These options can be found in the Chart bundle of resources of the graph object. In GSL you would use:
set page_1.viewport_1.domain_1.graph_1
 ( XuNsmoothingFactor = 4,
   XuNpointsPerSegment = 9
 );
 The
same smoothed line can be generated in GSL. First you must work out the
x values to use:
The
same smoothed line can be generated in GSL. First you must work out the
x values to use:
newx = range(1//4,31);
# 31 = 4 original points plus 27 new ones
and then you must use the smooth function to calculate the y values.
newy = smooth(x,y,newx,4);
Now plot newy against newx instead of y against x. Note that the smoothed curve will represent the positions of the original points, but may not necessarily pass through them.
An alternative to smooth() is the spline function which is only available
as a GSL function (and from the interpolation menu of the DataManager).
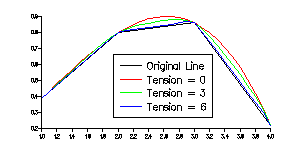 The
curve created by spline will pass through the original points. The fourth
argument to the spline function is the tension and it must be in the range
1 to 10:
The
curve created by spline will pass through the original points. The fourth
argument to the spline function is the tension and it must be in the range
1 to 10:
x = 1:4;
y = rnd(4);
newx = range(1//4,31);
newy = spline(x,y,newx,4);
create Viewport page_1.viewport_1; create Domain page_1.viewport_1.domain_1; create Graph page_1.viewport_1.domain_1.graph_1 ( XuNgraphType = "line", XuNxData = "newx", XuNyData = "newy" );
Polyfit
polyfit() calculates a polynomial of up to degree five that best fits
the input data. A polynomial of degree 1 is a line, of degree 2 is a parabola.
With polyfit(), there are no restrictions on the order of the input data.
As with all interpolation routines it is possible to specify the locations
at which the interpolation is calculated. For most interpolations it is
best to choose enough points to make a smooth curve, but for polyfit I
choose only enough points so that I can calculate the co-efficients of
the polynomial which I can then use in further calculations or to construct
any required line. See more after the following example.
 Example
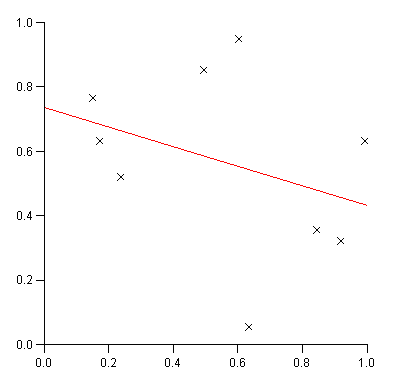
1 - Linear Regression
Example
1 - Linear Regression
x = rnd(9);
y = rnd(9);

nodes = 0//.5//1;
poly = polyfit(x,y,nodes,1);

create Viewport page_1.view
 ( XuNxRatio = 1,
   XuNyRatio = 1
 );
create Domain page_1.view.dom;
create Graph page_1.view.dom.graph
 ( XuNgraphType = "scatter",
   XuNsymbol = "x",
   XuNxData = "x",
   XuNyData = "y"
 );
create Graph page_1.view.dom.graph2
 ( XuNgraphType = "line",
   XuNxData = "nodes",
   XuNyData = "poly"
 );
The formula for a line is y = f(x) = mx + c
f(0) = 0*m + c = c therefore c = f(0)
f(1) = 1*m + c = m + f(0) therefore m = f(1) - c
In the above example we have calculate where x=0, .5 and 1.
So f(0) is poly[1], f(.5) is poly[2] and f(1) is poly[3]
c = poly[1];
m = poly[3] - c;
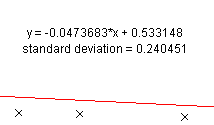
Once the co-efficients have been found it is possible to calculate the corresponding points on our fitted line to our input points and then calculate the standard deviation:
newy = m*x + c;
std_dev = std(y-newy);
 Calculated
values can then be displayed on the plot:
Calculated
values can then be displayed on the plot:
create Note page_1.view.dom.Note1
 ( XuNposition = (50,70),
   XuNtext = "'y = '+m+'*x + '+c"
 );
create Note page_1.view.dom.Note2
 ( XuNposition = (50,65),
   XuNtext = "'standard deviation = '+std_dev"
 );
Polynomials of degree 2
A similar technique can be used for polynomials of degree 2:
y = f(x) = a*x2 + b*x + c

f(0) = c
f(1) = a + b + c
f(-1) = a - b + c

c = f(0)
b = ( f(1) - f(-1) ) / 2
a = f(1) - b - c
which in GSL can be written as:
nodes = -1//0//1;
poly = polyfit(x,y,nodes,2);
c = poly[2];
b = (poly[3] - poly[1]) / 2;
a = poly[3] - b - c;
Polynomials of degree 3 or more
The effort to solve these equations increase as the degree of the polynomial
increases. Luckily Gsharp includes a function, matsolve() which will do
the work for us.
We have the following equations
x1^3*a + x1^2*b +x1*c + d = f(x1)
x2^3*a + x2^2*b +x2*c + d = f(x2)
x3^3*a + x3^2*b +x3*c + d = f(x3)
x4^3*a + x4^2*b +x4*c + d = f(x4)
which we need to solve for any x1, x2, x3 and x4.
This can be expressed in matrix notation as:
x1^3 x1^2 x1 1   a   f(x1)
x2^3 x2^2 x2 1 * b = f(x2)
x3^3 x3^2 x3 1   c   f(x3)
x4^3 x4^2 x4 1   d   f(x4)

if      a   f(x1)
    M * b = f(x2)
        c   f(x3)
        d   f(x4)

then  a          f(x1)
      b = M^-1 * f(x2)
      c          f(x3)
      d          f(x4)
or even coeffs = matsolve(M,f(x1)//f(x2)//f(x3)//f(x4))
The following GSL can be used to solve these equations (this function
can be found in the library libgen.gsl):
function float PolyFit(float x, float y, float deg)
         float nodes, poly, coeffs, M;

         nodes = range(x,6);
         poly = polyfit(x,y,nodes,deg);

         nodes = transpose(nodes);
         M = transpose(nodes^5 // nodes^4 // nodes^3 // nodes^2 // nodes // (1,1,1,1,1,1));
         coeffs = matsolve(M,poly);

         return slicex(coeffs,6-deg:6);
         endfunction
Example 2 - Polynomial of degree 5
include "$UNIDIR/lib/libgen.gsl";
x = rnd(9); y = rnd(9); coeffs = PolyFit(x,y,5); newx = range(x,100); newy = coeffs[1]*(newx^4) + coeffs[2]*(newx^3) + coeffs[3]*(newx^2) + coeffs[4]*newx + coeffs[5]; reset; createViewport page_1.view ( XuNxRatio = 1, XuNyRatio = 1 ); create Domain page_1.view.dom; create Graph page_1.view.dom.graph ( XuNgraphType = "scatter", XuNsymbol = "x", XuNxData = "x", XuNyData = "y" ); create Graph page_1.view.dom.graph2 ( XuNgraphType = "line", XuNxData = "newx", XuNyData = "newy" );
Linear
It is also possible to perform a linear interpolation on (x,y) points.
Calculate points will lie on a straight line connecting consecutive points.
This form of interpolation is available throught the GSL function linear