Climate
Synopsis
Provides an example application encompassing the following features and capabilities:
- Multiple graphical display windows, each displaying multiple disparate data types
- Multiple simultaneous animations in separate windows
- Imposition of isosurface and orthoslice representations on both a
2D image and a data-mapped 3D geometry
- Innovative data-presentation techniques to enhance end-user understanding
|
 |
Key AVS/Express Modules Used
- rect_climate
A combination of Express-standard modules including FPlane, bounds, advector, ReadImage, isosurface, combine_vect, and texture_mesh.
- sphere_climate
A combination of Express-standard modules including isosurface, orthoslice, extract_scalar, and Read_Geom.
- Uviewer3D
Standard Express module that defines all of the necessary components
for the display portion of a graphics application.
Analogous Applications
- Medical Analysis - Multiviewer comparative analysis of patient data; orthoslice views.
- Plant-floor Operations - Simultaneous micro- and macro-views of a plant floor.
- Oil & Gas Exploration - Registration of multiple data sources; orthoslice views of volume data.
Instructions for use
- Open the Climate demo by dragging its object from the library into the Application
space.
In AVS/Express, you begin building an application by finding the objects
you need in the Libraries section of the Network Editor and then dragging
them into the application workspace. This process is called instancing.
When you instance an object, the AVS/Express Object Manager executes the
functionality associated with that object.
So in this case, where the Climate object represents a complete (albeit
simple) application, instancing it causes it to execute the completed Climate
application. To learn more about instancing objects, see AVS/Express
Concepts, Getting Started with AVS/Express, Section 2.2 Instance Objects
in the Network Editor.
- In the application windows that open, notice the three main components:
- The tallest, vertically oriented window, called Climate, holds a panel
devoted to user interface controls, or Editors. At the top of this panel,
note the drop-down menu labeled Modules, with Summary as the currently
selected menu item and the other Modules that make up Climate also listed.
Choosing a Module in this menu causes its controls to appear in the panel.
For now, we'll leave Summary chosen because it provides a top-level user
interface for the overall Climate demo. It does this by presenting the
most important subset of controls for the Modules doing the real work.
In that respect, this panel is a simple example of an application-specific
UI that you might create.
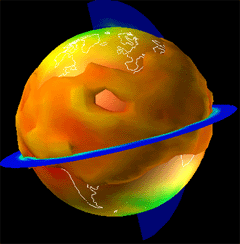
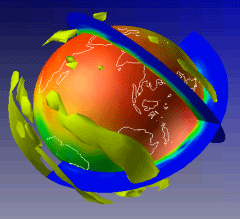
- The Scene#1 window is referred to as a DataViewer, which is where AVS/Express
displays data and the end-user interacts with it. Scene#1 shows a sphere
with color-mapped data as well as 3D data representations surrounding
it.
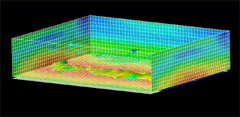
- The Scene window is a second DataViewer and has the same general interactive
qualities as the Scene#1 window, but shows a wireframe box with a 2D image
as a floor or backwall and both 3D and vector data representations overlaid.
- Back in the Summary panel, do this:
- Click the Animate Wind checkbox so that it is checked. In the Scene window,
the arrows representing wind vector data begin cycling through an animation
sequence.
- Click the Animate Slices checkbox so that it is checked. In the Scene#1
window, the orthogonal slices representing latitudinal and longitudinal
positions begin cycling through an animation sequence.
Interacting with Data in the Data Viewer
In the display area of either Scene window (Scene or Scene#1), click and drag
with the left mouse button; the scene rotates. Releasing the mouse button while
dragging causes the scene to rotate continuously until clicked.
Controls in the Individual Module Editors
The following section briefly covers the editors for the most important individual
modules within the Climate demo.
- Arrange the Scene#1 (sphere) window and the Climate (Editor) window so that
you can see both of them.
- In the Climate window, find the Modules drop-down menu and choose Modules
-> Surface Component. The Surface Component Module Editor appears.
| Ā |
|
|
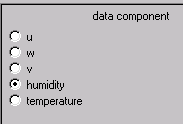
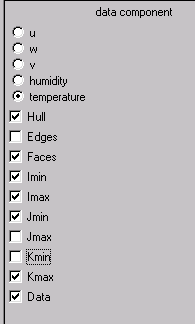
u, v and w refer to the mapping coordinates for a texture to the sphere:
u is width, v is height, and w is depth.
Choosing u, v or w maps the corresponding component of the velocity
field (like an xyz value for each point that indicates direction) to
affect the color mapping on the sphere.
The humidity radio button causes humidity data to be mapped to the
sphere's surface as ranges of color.
The temperature radio button causes temperature data to be mapped to
the sphere's surface as ranges of color.
|
Change the selection to humidity and observe the effect on the sphere display;
change the selection back to temperature.
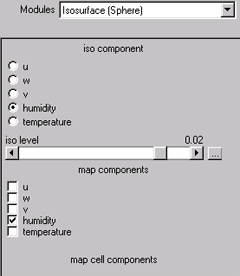
- Use the Modules drop-down menu to choose Isosurface (Sphere).
The Isosurface (Sphere) Editor appears.
|
This module controls the data-mapping and scaling of the isosurface
imposed around the sphere.
The iso component radio buttons choose which type of data the isosurface's
shape will represent; the iso slider has a unique range for each possible
component. Click the "..." button to see the min and max
values per component selection. If you change a value, press Enter
to commit your change.
Ā
|
|
|
Choose humidity for iso component and temperature for the map component,
which controls the color-mapping of the isosurface. Then adjust the
iso level slider to about 0.01.
The iso slider determines the value to display for the chosen iso
component: the resulting isosurface indicates the presence of that
value. The temperature choice for map component colors the isosurface
according to the temperature values at those same points.
|
|
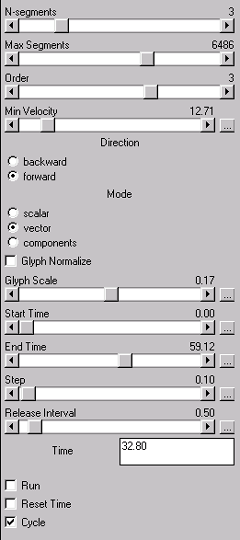
- Use the Modules drop-down menu to choose
Animate Wind. The Animate Wind Editor appears.
|
This module controls the various attributes of the wind animation in
the Scene (rectangle) window.
The top set of sliders are used to control various aspects of the wind
simulation. Think of the area over which the simulation occurs as a
grid. N-segments, put briefly, specifies the number of steps used to
calculate a cell's worth of movement; Max Segments sets the upper limit
on that detail. Order further specifies the detail level of each calculation
step. Minimum Velocity filters out particles based on their velocity.
Direction controls the simulation direction. Under Mode, the main difference
between Scalar and Vector is the directional quality of the resulting
glyph. Components is more powerful when used with more-detailed glyphs
than are shown here; it maps additional vector detail onto the glyph's
scaling.
Glyph Normalize and Scale adjust the size of the arrow representations,
singly and relative to each other.
The Start Time, End Time, Step and Release Interval sliders all control
simulation attributes and can each be rescaled by clicking the "..."
button.
|
|
- Use the Modules drop-down menu to choose
bounds. The bounds Editor appears.
|
This module is quite simple but demonstrates some important display
capabilities.
The combination of choices shown at the right yields the following
scene by making certain sides of the bounding box not only visible but
data-mapped:
Ā
|
|
- Take a moment to look at each of the Read_* module Editors. Each one allows
user specification of a file to be read into the application, whether for
an image, a geometry, or a dataset to be used.
- Choose Modules -> FPlane and adjust each slider slightly to the
right. Note the increased density of data display in each dimension.
To exit the Climate application
If you wish to continue, skip to the next section and come back to these instructions
when you are finished working.
- Exit the Climate application from the application itself by choosing File
-> Exit.
- Exit AVS/Express by choosing File -> Exit from the AVS/Express Network
Editor window.
Discussion of Key Modules
For this section, please switch to the Network Editor Window. The Network
Editor looks like this:
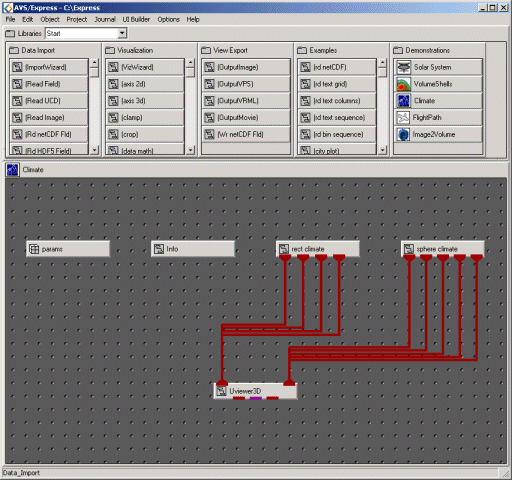
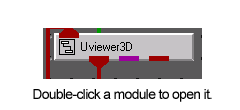
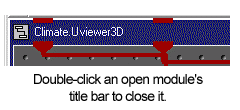
You can view the sub-components of any module by double-clicking directly
on it; close any opened module by double-clicking its title bar. You can see
man-page style help on any module by right-clicking it and choosing Help from the resulting contextual menu.
Ā
Ā
Uviewer3D
Uviewer3D defines all of the necessary
components for the display portion of a graphics application: a default graphics
window like the ones in which you are viewing the Climate app, and a collection
of user interface editors that you can use to control the display of these objects.
Uviewer3D is fed information about the items it needs to render by rect_climate
and sphere_climate, which are covered below.
sphere_climate
sphere_climate handles presentation
of the climate data in the Sphere Scene window, available by choosing Windows
-> Sphere scene. It does this by combining several AVS/Express-standard modules
to cover various functions. FPlane
generates a 3D plane of variable size that can be transformed in three dimensions,
making it useful for sampling or slicing data before it is fed to another object.
In this case, it is applied to the netCDF file brought in by Read_Rect_Data
to produce the rectilinear representation of the weather data. isosurface
creates a 3D isosurface representing the data type mapped to it, in this case
the rectilinear field that was read in by Read_Rect_Data.The bounds
module generates a bounding area for the rectangular climate display, with the
various parameters and their effects already shown above.
advector provides many of the
controls seen in the Animate Wind module shown above;
behind the scenes it places massless particles into the vector stream described
by the actual wind data to create a visible representation of the wind's movement.
combine_vect does exactly
what its name indicates: it combines u, v and w into a node data vector to describe
wind direction in this case. This enables the advector macro to construct particle
paths through the vector field defined by this new node data vector.
rect_climate
rect_climate handles presentation
of the climate data in the Rectilinear Scene window, available by choosing Windows
-> Rectilinear Scene. It does this by combining several AVS/Express-standard
modules to cover various functions: isosurface,
which creates a 3D isosurface representing the data type mapped to it; orthoslice,
which produces a cross-section of the data; extract_scalar,
which pulls the data corresponding to a specified vector component of a field;
and Read_Geom,
which reads in a file representing the contour of the globe.
Ā
Ā
Discussion
of Analogous Applications
Medical Analysis
The ability to view multiple scenes representing
related data collections could be used to combine data from multiple patients
for comparative purposes, various facets of a single patient's condition for
correlative analysis, or educational applications for demonstrating relationships
between multiple systems within the body, for example under changing conditions
such as temperature or exertion.
Plant-floor Operations
Similarly to the medical example just
described, the ability to view multiple related data sets could be used to examine
behavior of multiple machines on the same plant floor under changing conditions,
or to view multiple possible designs of an identically purposed piece of equipment
for simulation-based comparative analysis.
Oil & Gas Exploration
Registration of seismic data and
analysis of large-volume data are just two challenges related to oil & gas
exploration that could be addressed in a custom AVS/Express application employing
some of the same data processing and visualization techniques used in this Climate
demo application. In particular, FPlane
and orthoslice
have clear uses for analyzing exploration data, and advector
could be used in an application that simulates flow behavior around a given
well.
Ā