Colormap Editor
The Colormap Editor provides a convenient graphical interface for modifying the coloring information of an object's datamap.
The diagram below illustrates the components of the Colormap Editor interface.
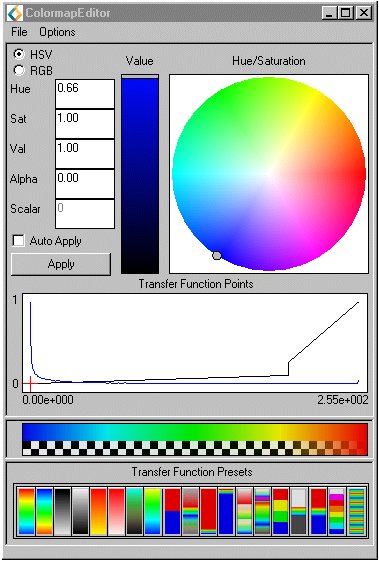
Colormaps are defined by a set of control points indicated in the Transfer Function Points graph in the lower portion of the Colormap Editor. The horizontal axis represents the data range defined by the input colormap and the vertical axis represents the opacity of the color for the given value. The colored band across the bottom indicates the colors to be mapped to corresponding points in the data range of the Transfer Function Points chart.
You can create and adjust control points to produce the desired data-to-color mapping. Create a control point anywhere along the transfer function by clicking the right mouse button (RMB). Select a control point by clicking the left mouse button (LMB) over the desired point on the transfer function. Once a control point is selected, you can assign a color to that point using the color selection interface in the upper portion of the editor. A control point can be relocated by dragging it with the LMB. Control points can be deleted by holding down the Shift key and clicking over the desired control point with the RMB.
The colormap maps the data values at control points to the color and opacity values assigned at those points. Color and opacity values are calculated by interpolation for data values falling between defined control points. There is a color map legenged with a checkerboard patern underlay that shows transparency. A good way to view this effect is to instance the various VolumeRend examples. VolumeRendTransparent is the best example.
At the bottom of the Colormap Editor there is a selection of presets. Click on one of the icons to select it.
The Transfer Function Points interface can also display a histogram of the input data values.
The auto-histogram feature can be turned on and off via the Options menu. This is off by default. The input field for the histogram can be obtained from the input GDobject.
Also in the Options menu the histogram log. This mode can be turned on and off and is set to off by default.
The Auto Apply button causes the datamap, as configured in the Colormap Editor to be loaded into the connected object. The Apply setting causes this refreshment to take place each time the datamap is changed in the editor. A datamap that has not been loaded into the connected object will be overwritten if the trigger ( initialize parameter) is tripped.
Note that the Colormap Editor acts on the object that is currently selected. If no object is selected when the Colormap Editor is instantiated, the object on top becomes selected. Be sure that the object that is selected is in fact the one you intend to edit.
The Colormap Editor has four input ports:
histogram_values
The output port gives access to the values depicted in the histogram.
Upon initial connection, the Colormap Editor interface will reflect the current datamap values.
The Colormap Editor allows you to save datamap configurations and read in previously saved datamaps. You may wish to save a datamap before modifying it in the editor so that you can revert to the original map if desired. You can save any number of datamap configurations using the Save command from the File menu. The Load command in the File menu allows you to read in a previously saved datamap. When you load a colormap that has a different data range the option will use the min and max values from the newly loaded colormap. Load Scaled is another option in the File menu. This option will adjust the new colormap so that its min and max values match the previous colormap.
- The Colormap Editor defines continuous color ranges. Thus all intermediate color ranges are defined by interpolation between two control points. The Colormap Editor can not accept as input colormaps based on one of the older Datamap formats which defines a mapping based solely on multiple discrete control points (e.g. defaultStep). One can simulate a discrete mapping by defining color ranges that begin and end with the same color.